MA Digital Media
What is Digital Media?
We living in the world where Digital Media is becoming vital. But, if we ask, "What is Digital Media?." It might be hard to answer. It covers a lot. Nowadays, we often simply list the media technologies such as Instagram or TikTok as 'new'media. But we have to bear in mind that all 'old' media such as Newspapers and radio were once seen as 'new' media too. However, unlike traditional media, which is often one-way interactive, digital media enables dynamic and interactive and much more often real-time communication.It is characterized by its reliance on the internet.
When we think about Digital Media, concepts such as convergence, participation and Data-Driven become the key. Convergence as theorized by Henry Jenkins (1992), refers to the mixture of different digital media platforms, enabling content to flow across multiple formats. One popular example here would be Snapchat. While being a social media platform that allows communication between friends, it also allowed a interactive feature of maps, so you could see where your friends are located.
Participation is also another central point in Digital Media. As it empowers each individuals and communities to actively engage and create their own content rather than being a passive conusmer.
One last thing to mention here is Data-Driven. This aspect of digital media highlights the importance of algorithms which differs than traditional media. It focuses on the data collection of audiences which thus influence what types of content we receive.
Week 2 October 11th
Creating Websites

This was the first week of Digital Practices.In this week, the website was created which I adopted the template from HTML5UP.
We started looking at HTML and CSS codes and how we are going to use them in the process.
The website was uploaded to the server using FileZilla and cPanel in order to remote web space.
A website was built using a combination of the template and hand written codes. These codes are going to be written using software such as' Brackets'.
Week 3 October 18th
Web Scraping
After we have understood how online resources are constructed, we could start asking questions about their construction and collect data related to the way that things are built and represented. By thinking about structures as data, we can collect them, compare them, change them and replace them to ask and answer all kinds of questions about digital societies.
As Bucher (2018) explores in the reading that algorithms function as ordering mechanisms, structuring what information is visible in digital spaces. Bucher (2018) emphasized that algorithms create dynamic orders, they are not passive tools but active agents in organizing social, economic, and cultural life. He then argues that algorithms embody some kind of power that could shape behavior, control access and influence decision-making.
During the workshop, Dr. Chris Birchall introduced us with the process of Web Scraping. As most online content can be harvested from the underlying code and tools can be used to harvest the data.
After a short exercise on inspecting data on a website, we went to Outwit Hub, where we could create a scraper. Using the 'Find in Page' box in the HTML code, I identfied the content of this type, so that I could scrape it. Then I just created a scraper by adding the code that encapsulate content into the table.
This was a completely new concept and process that I have never done before, so it was quite challenging. The ability to scrape data and analyze patterns reveals how algorithms concentrate power in the hands of those with the skills and resources. It could uncover biases in algorithmic decision-making. At the same time, raising the ethical question about privacy and consent.
Week 4 October 25th
Data, Power and Classification
As I have mentioned in the first week, data-driven is a key concept in Digital Media.
In Week 4, during the Lecture, we were posed with a question of 'What is Data'.According to what Gitelman and Jackson (2013) said,'Data are units or morsels of information' that can be processed by a computer (Posner and Klein, 2017).
Crawford(2021)revealed in the readings how the collection and classification of data are deeply interwined with power structure.
As Crawford (2021) writes:
'The way data is understood, captured, classified, and named is fundamentally an act of world-making and containment'.
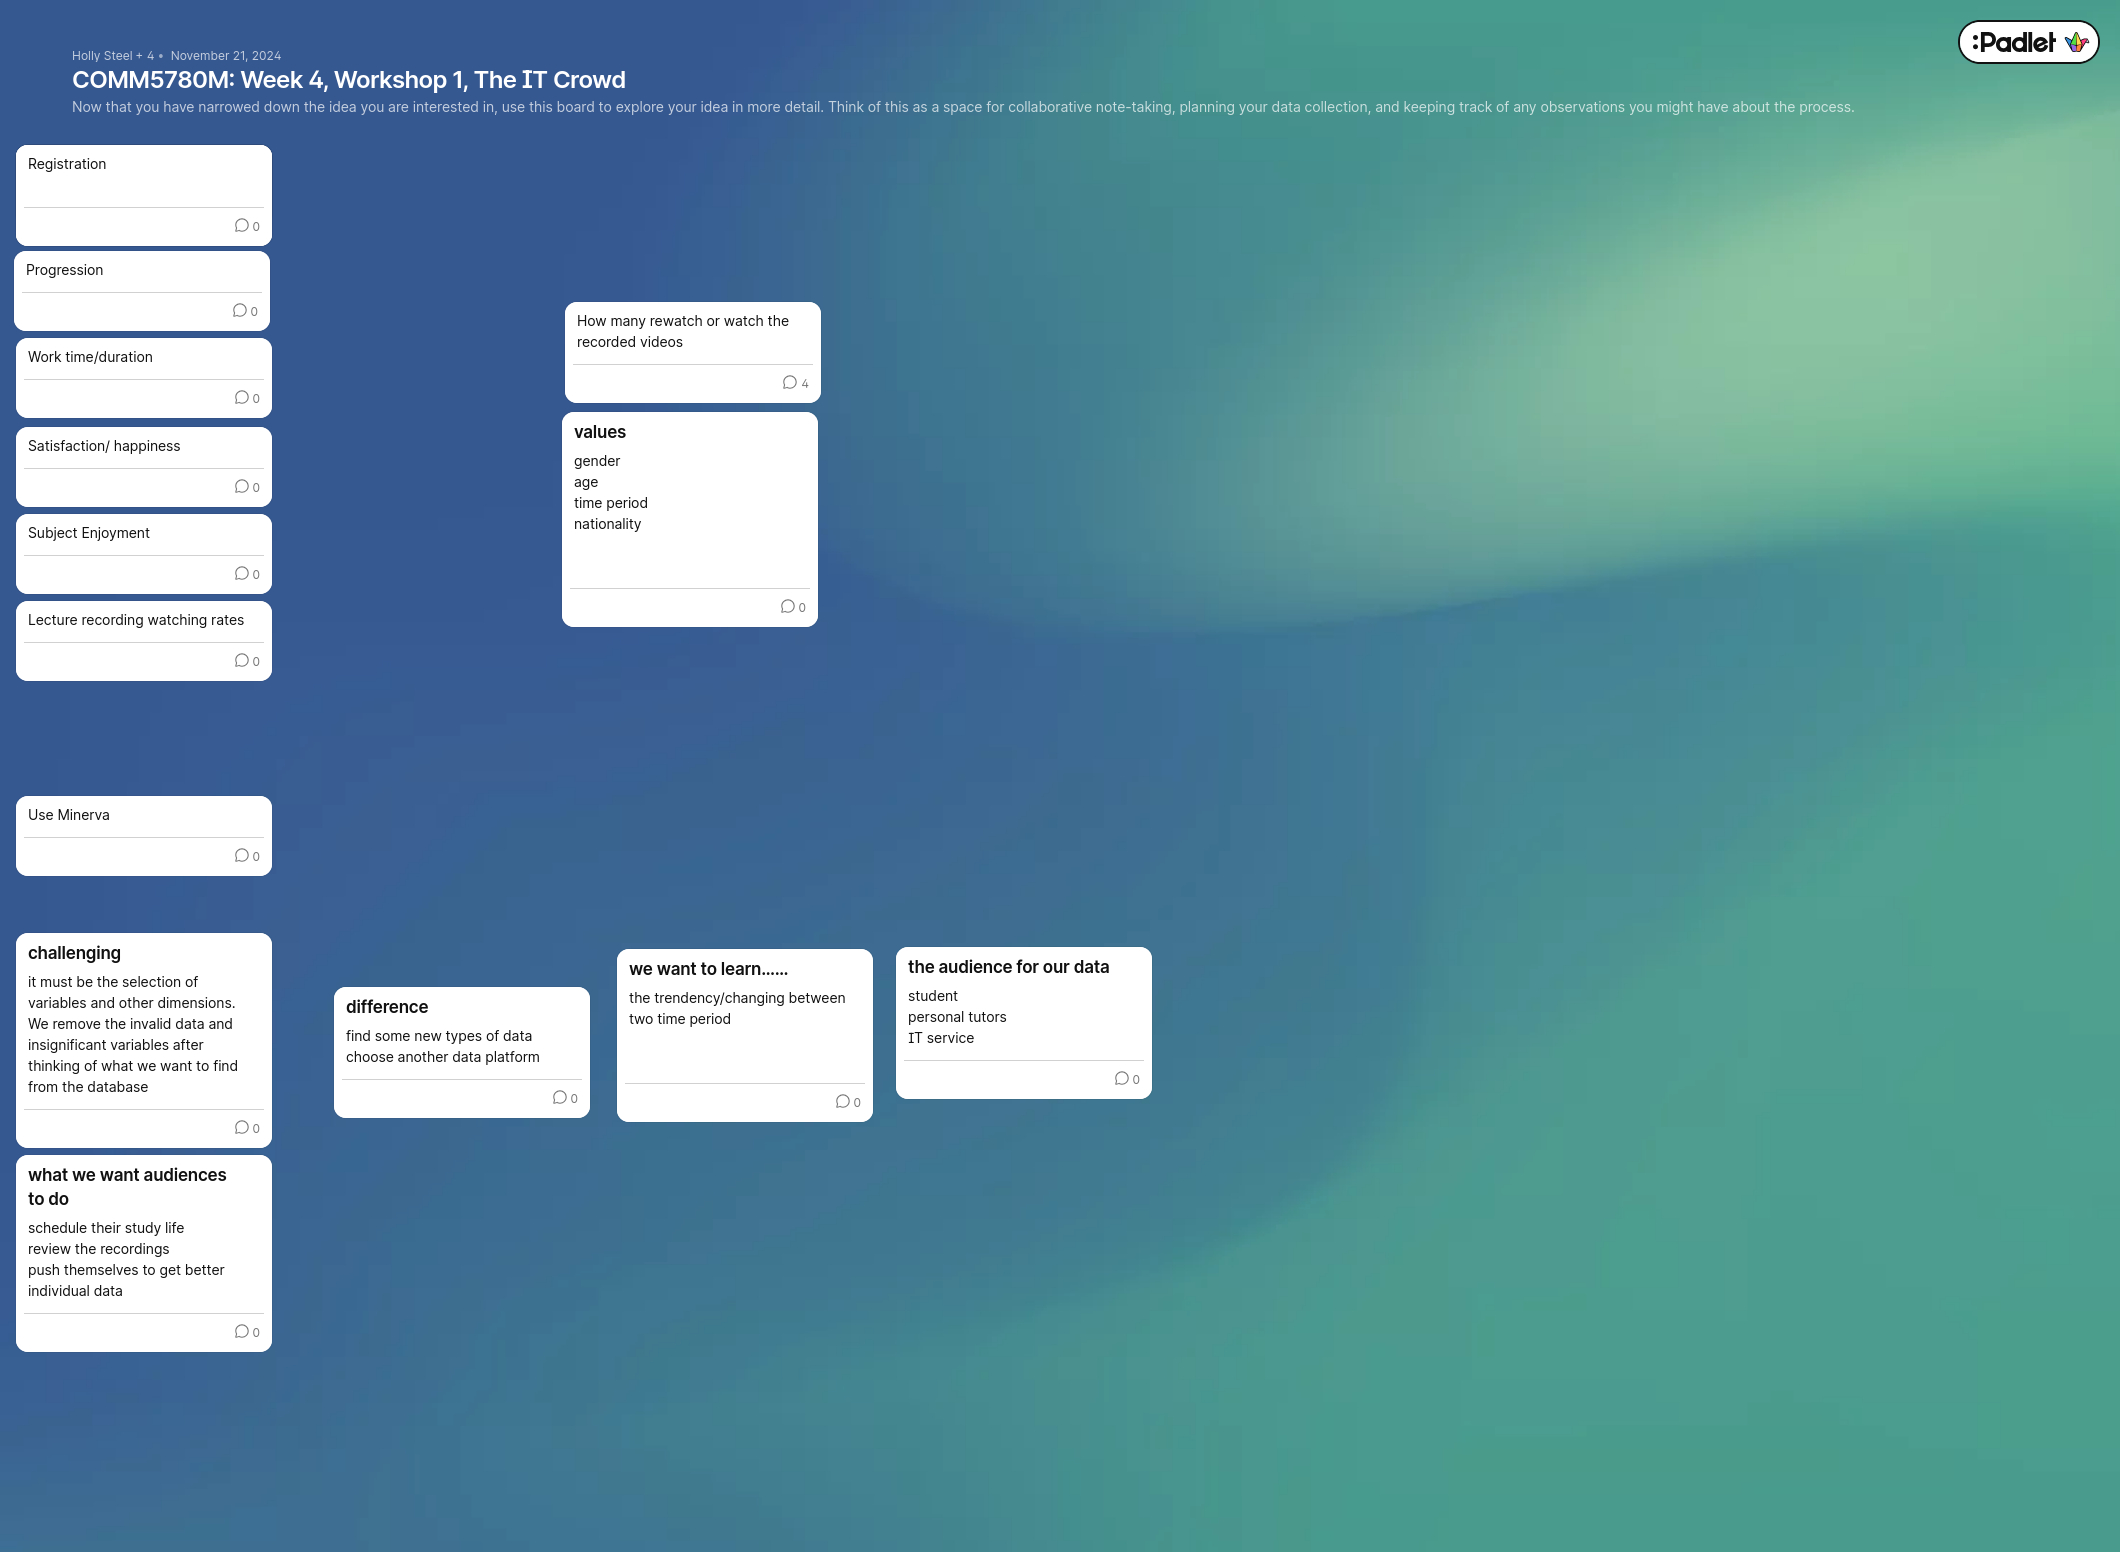
The workshops Dr.Holly designed were to help us to explore issues relating to ethics, data, and power.
We started by exploring different scenarios and cosidering the types of data we might collect. In order to make the best effect, we were grouped to collaboratively map our ideas, note our observations, and plan data collection. We have noted down a few notes to settle our scenario:student-led Data collection.
We decided to work on how students' use of minerva change between the beginning of the semester and after four to five weeks of the semester. We had to discuss the ethical implications of collecting our data and identify what biases or assumptions might be found in the data.
Week 5 November 11th
Data Visualization
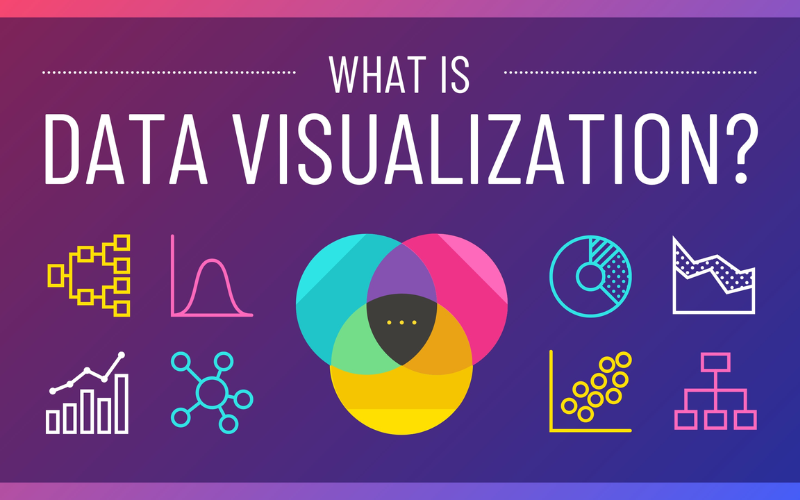
Though data can tell us a lot already, we still need the skills and expertise to translate data into insights. Data visualization is a powerful and popular way to communicate knowledge gained from data. During the workshop in Week 5, we looked at some of the data visualization tools available and examined how the process of visualization help shape messages and narratives.
Before we actually started doing data visualization, we were asked to reflect on the workshop task in Week 4. As a group, we discussed what was most challenging during the data collection process. One of our group member said that it was the selection of variables and other dimensions. When we were selecting, it was hard to find data. As what we wanted to learn from the data set was the tendency or changes on the use of Minerva between the begining of the semester and half way through. Since we only had a data set between four members, it is a relatively small data set that cannot make a significant comparison. So we said that if we have the time and resources, it might be helpful if we could make a larger data set with a wider range of people.
Soon as we have reflected on the data, we started doing the data visualization. The main tool we used during the workshop was Tableau and Excel. I was feeling more comfortable with Excel, so that was my choice. We started with creating descriptive charts in Excel. Since our dataset was too small, and it was meaningless to create a barchart or any kind of visualization. I used the data set Holly created with European Social Survey (ESS). I took the data regarding the gender of respondent during a vote. After summarizing the numbers of respondents with Count if function on Excel, I have created a pie chart as shown below. You could see a more detailed data set in the following: Excel sheet
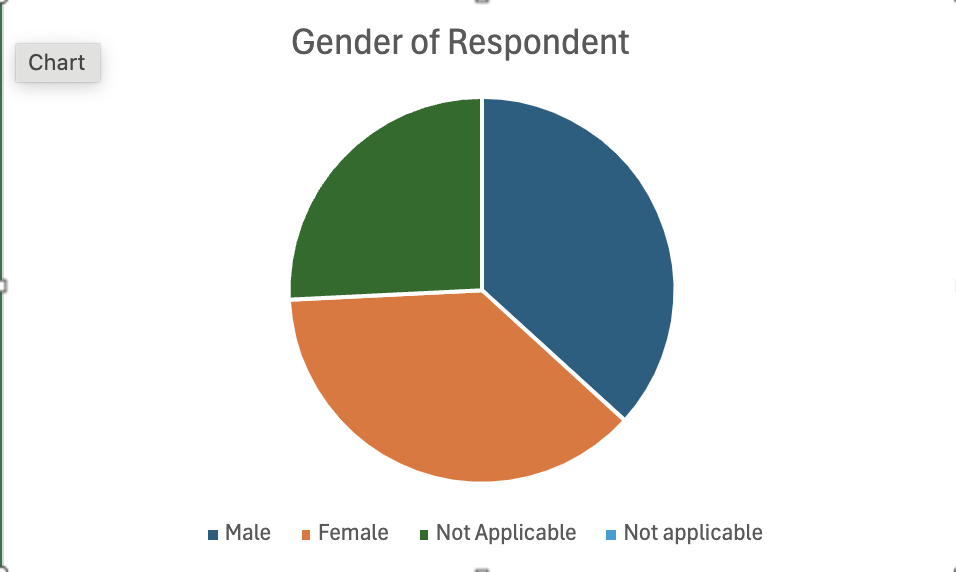
Such data visualizations can help us to better understand the data set.
Week 7 November 15th
Machine Learning
Before reflecting on this week's task, it is important to understand the terms. Machine Learning, according to Broussard (2023) is a subfield intelligence, and a form of computational statistics. When you use machine learning, you input data and instruct the computer to make a model.
In the Week 7 workshop, we used Teachable Machine to explore this process.
As our reading for this week by Scheuerman, Paper and Hanna (2021) was related to the facial analysis technologies being uses for identity recognition.However. there are still times when such technologies may mislabel people. Automated facial recognition may reinforce racialized gender binarie as they rely on data sets that are skewed. Besides the reading, we were asked to use Facework before the workshop. Here, it was simply classfied by gender and cultural bias which points our the broader ethical concern.
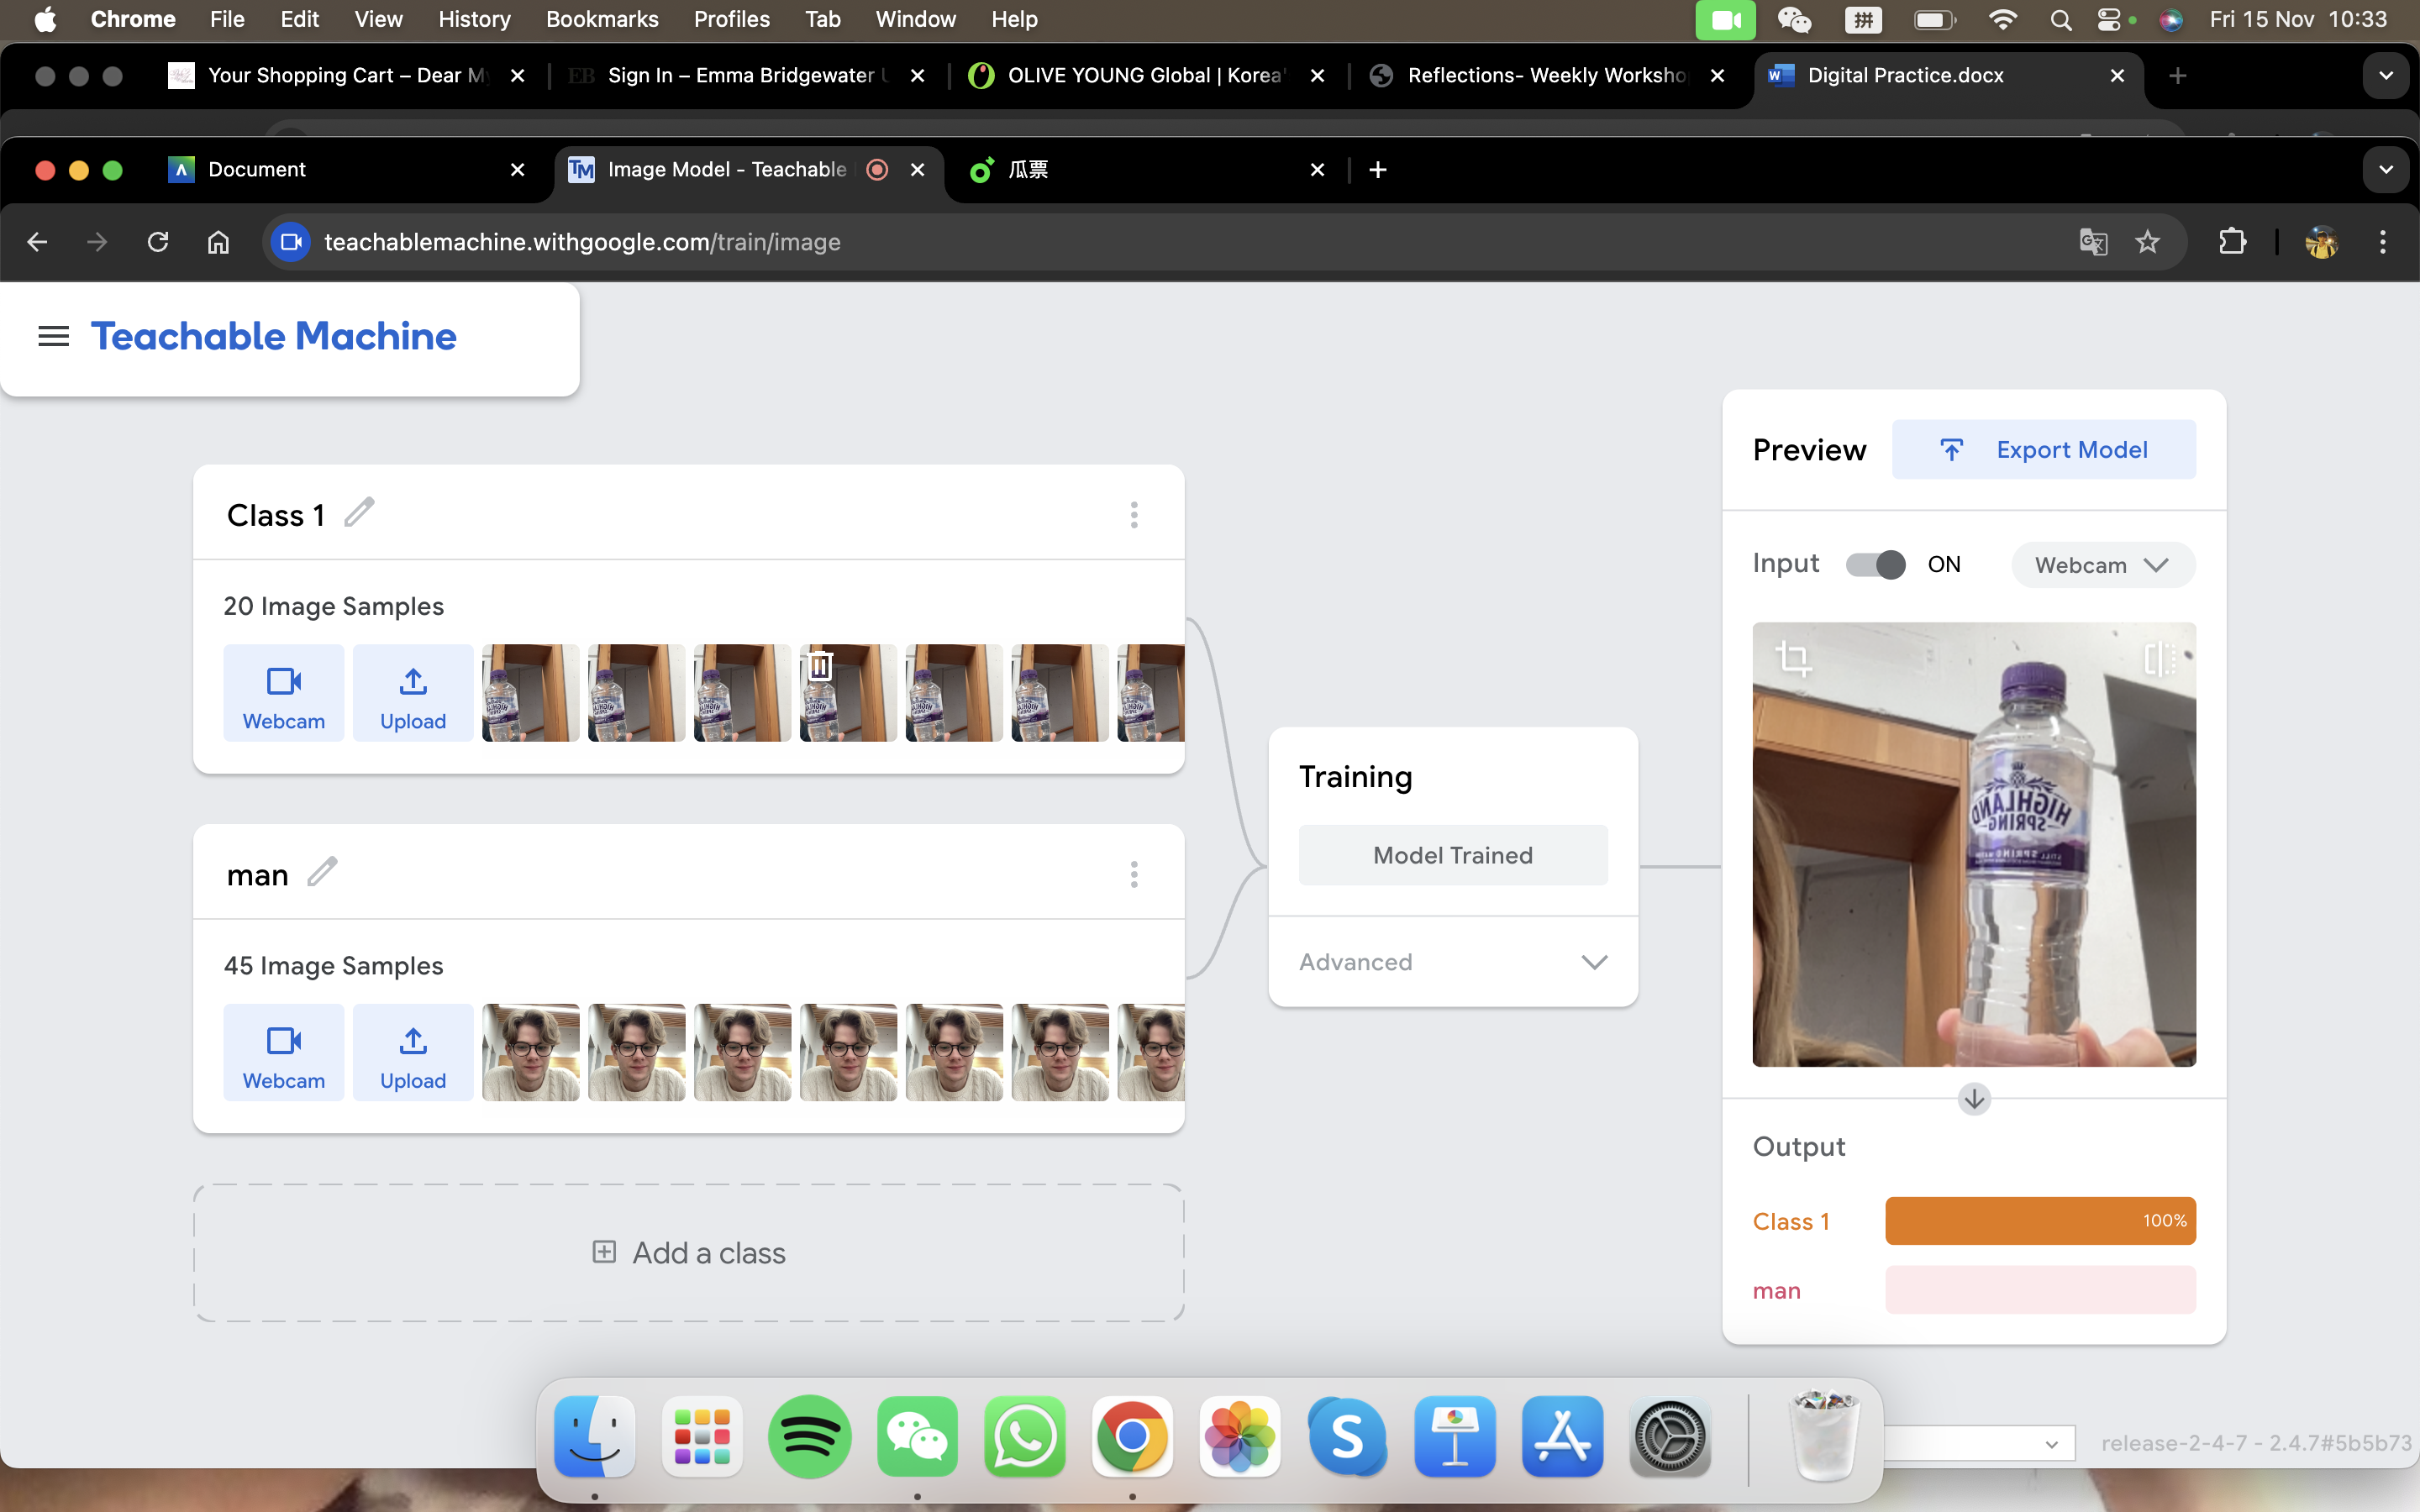
During the workshop, we first started by testing image projects. What we have done was to gather sample images for our model. So our group decided to put a water bottle as our 'Class 1' and our group member as 'Class 2'.Images were captured by the webcam. We have tested the model and of course, it could clearly say the difference between a bottle and a man.
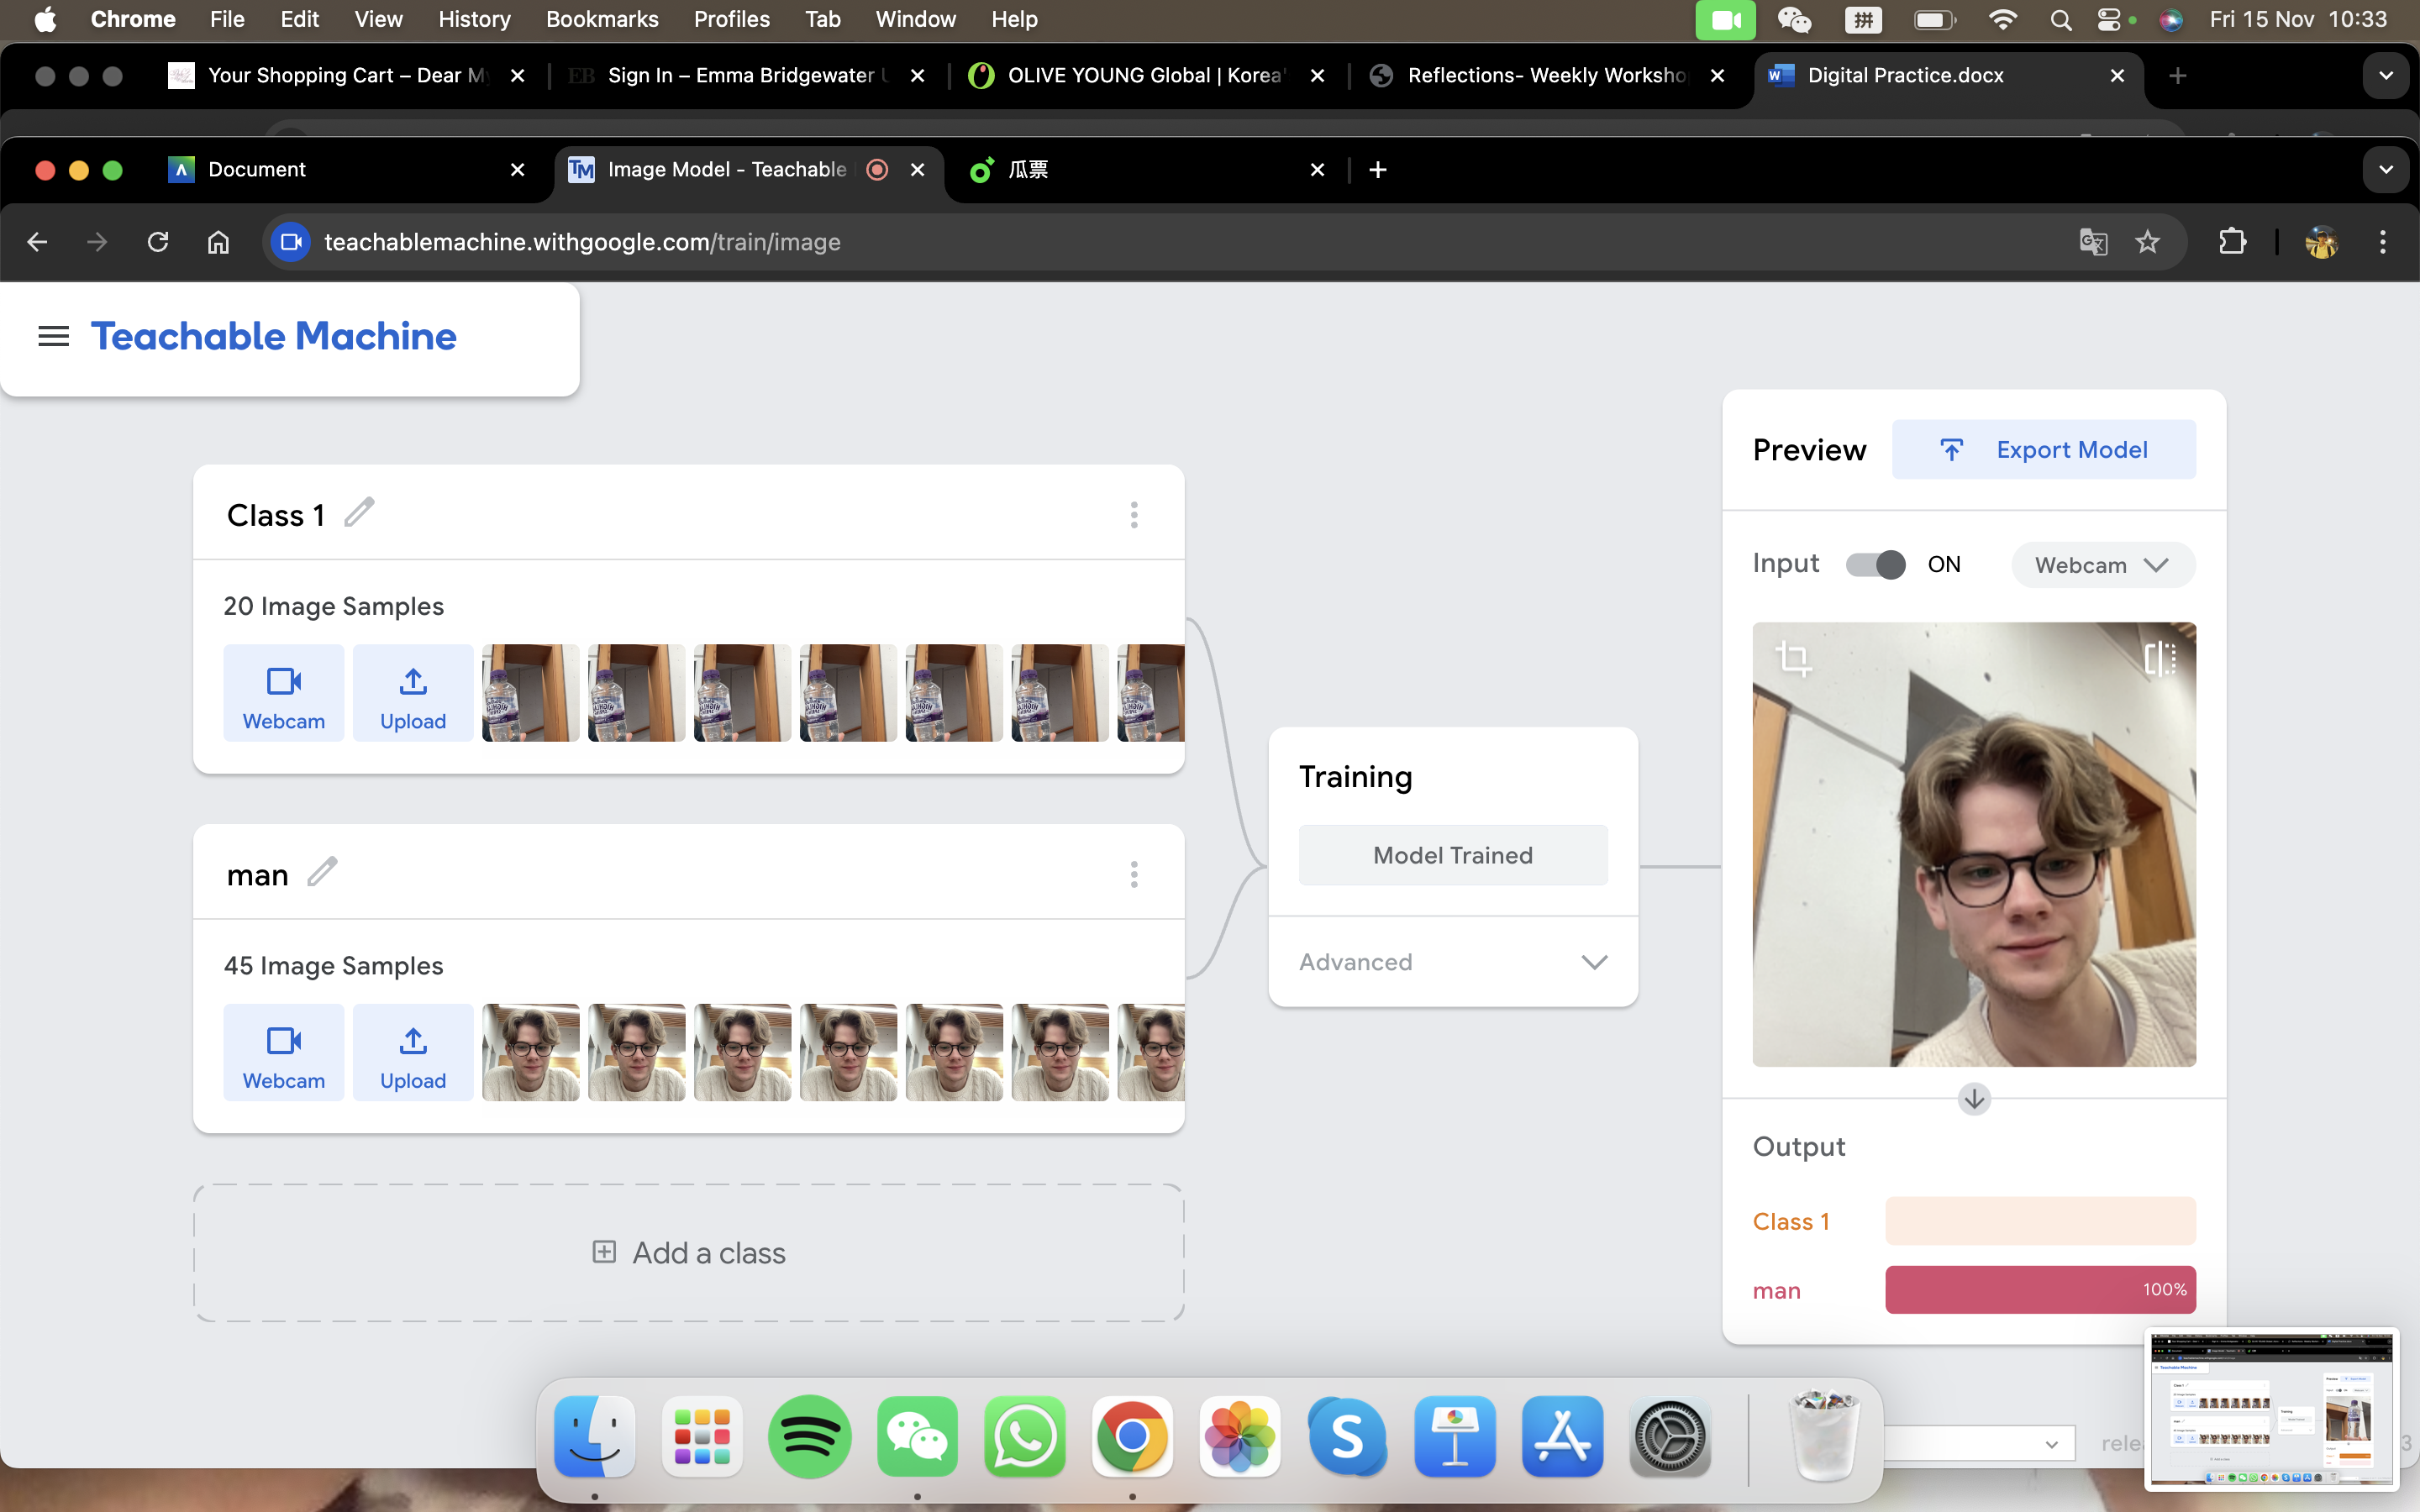
For the second model, we tried to confuse it with having two of our members wearing the same coat and standing in the same background. This time, Teachable Machine was not able to state clearly which class was present within the frame. Therefore, it is relying significantly on the input and are prone to biases and inaccuracies.
Thus, the process on Teachable Machine demonstrates that machine learning is a data-driven process of pattern recognition. Since it is a supervised learning where you tell the computer what features of the data are most important for making a prediction. It is analyzing pixel values of images and identifying correlations. Machine Learning is thus focusing on the mathematical processing, rather than real identification.
Week 8 November 22nd
Identity, Algorithmic identity and Representation

Ever since the celebratory proclamations about cyberspace in the 90s, it made us possible to create our identity. Cheney-Lippold (2017) referred algorithmic identity to the way algorithms construct and categorize our identities based on a data-drive process. Algorithms are everywhere, organizing the near limitless data that exists in our world. As Cheney-Lippold (2017) stated, such algorithms create us and recreate us, using our data to assign and reassign our gender, race, sexuality, and citizenship status.
During the workshop on Friday, Holly made me more clearer about how such algorithm identity are constructed and personalized. Cheney-Lippold argues that our algorithmic identity changes over time, dynamically. So whatever we do online, communicating with whom and what do we like and dislike, what we buy and where we go are under surveillance. However, such algorithms are created as we are constantly doing it again and again. This is also strongly connected to what we input, such as what data we are sharing online.
We started by discussing the data that we share about ourselves. Social media often is the place where we share our data about our lives. Holly first asked if anyone in the class are not using any social media. The answer is of course no. So we went on our chosen social media platform, for which I chose Instagram, went to the 'Privacy Center' where you could access my information in different categories. When I went through all the privacy items, I realized how horrible it is. It is almost taking all the necessary information about us, for instance, my activity and information provided, my interaction with my friends and followers,app or browser information,etc. But all these tracking of data are solely based on our online direct behaviors, so what we clicked on or who we talk to on these social media platforms will directly be reflected on our algorithms.
Once we have done our input section, I knew how these data are being processed in some way, but it is hard to work out how it is being processed. So we went through the second section of the workshop which is output. What we have done is going to our Google ad profile: Google Ad Profile where we could see the categories associated with the account.
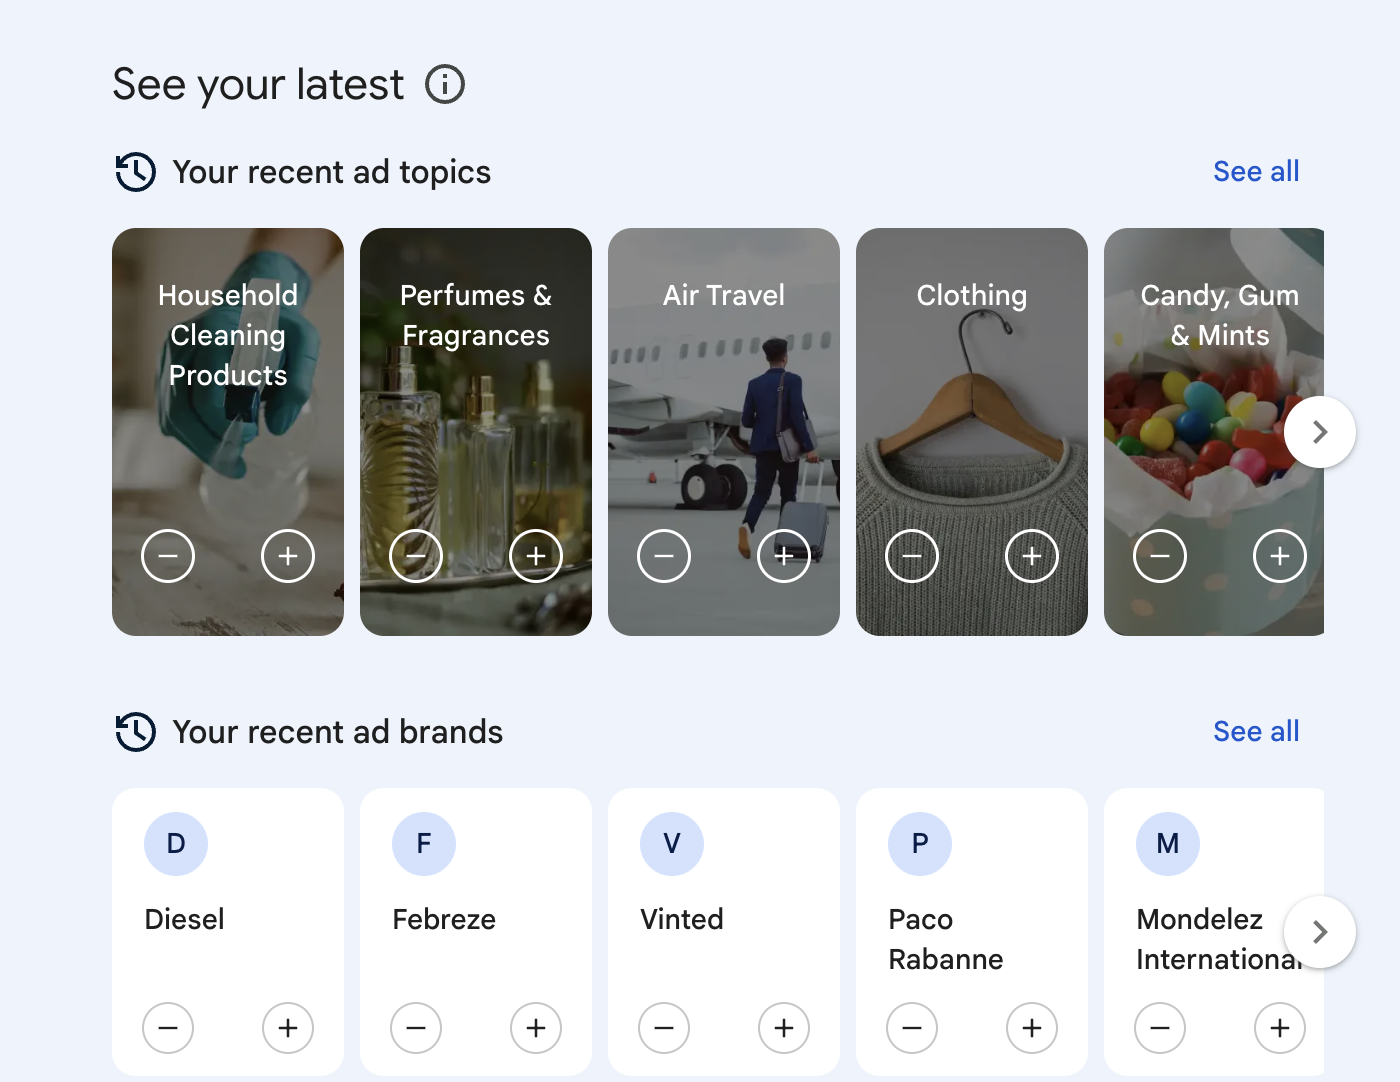
On the screenshot above, it was my topics for ads, as what Google explained activities on Google sites and apps are used to infer which categories are most relevant to you. These ads showed on my profile are what actually represents me. When I go back to Instagram, it was weird that I could not see any Ad topics or preferences. It might be that I have turned off the personalization of ads on my Instagram account. Though that I could not see how am I categorized according to my ad topics, I was still able to see the ads that had appeared on my Instagram page, these advertizements are showed based on my activity.
Finally, in our workshop, even though we did not have enough time to finish, we started taking the method from Sumpter's (2018) Outnumbered. What Sumpter did was to mathematically understand algorithms that social media uses to process our data. What we have done in this section of the workshop was to choose 32 friends on Instagram and choose 15 posts per person. Then put each of the 15 posts into one category that was set in Excel template. When I started doing this, I randomly picked a follower of mine on Instagram and started scrolling down through her profile. A question straight came to my mind, would a selfie be categorized as lifestyle or reflection? Would concerts fall into the category of local events or Music/Sport/Film? Everything was challenging to classify as they may be suitable for several categories. I had to think very carefully so that all the posts are distinguished and classfied in the same way, not to make any biases. As when I was going through the posts, I was only making a decision based on the photos posted, not relying on the caption, thus it made the process even harder.
As we did not have enough time during the workshop, we were asked to finish the manual sraping process at home. I sat down and started scrolling through the posts again, what I found interesting was that some people might have all lifestyles photos posted while some would only have outdoor views. I was repeating the process over and over, sometimes I would feel struggled as when I see another person's post, I might feel the categories need to be changed. If I change one of the results, then I needed to re-categorize the whole process again. Finally, I have came up with my final spreadsheet: SMA.
After I have done the spreadsheet, I tried to do the data visualization on Excel. I made one bar chart graph with all the categories included for each people. The graph came out as below.
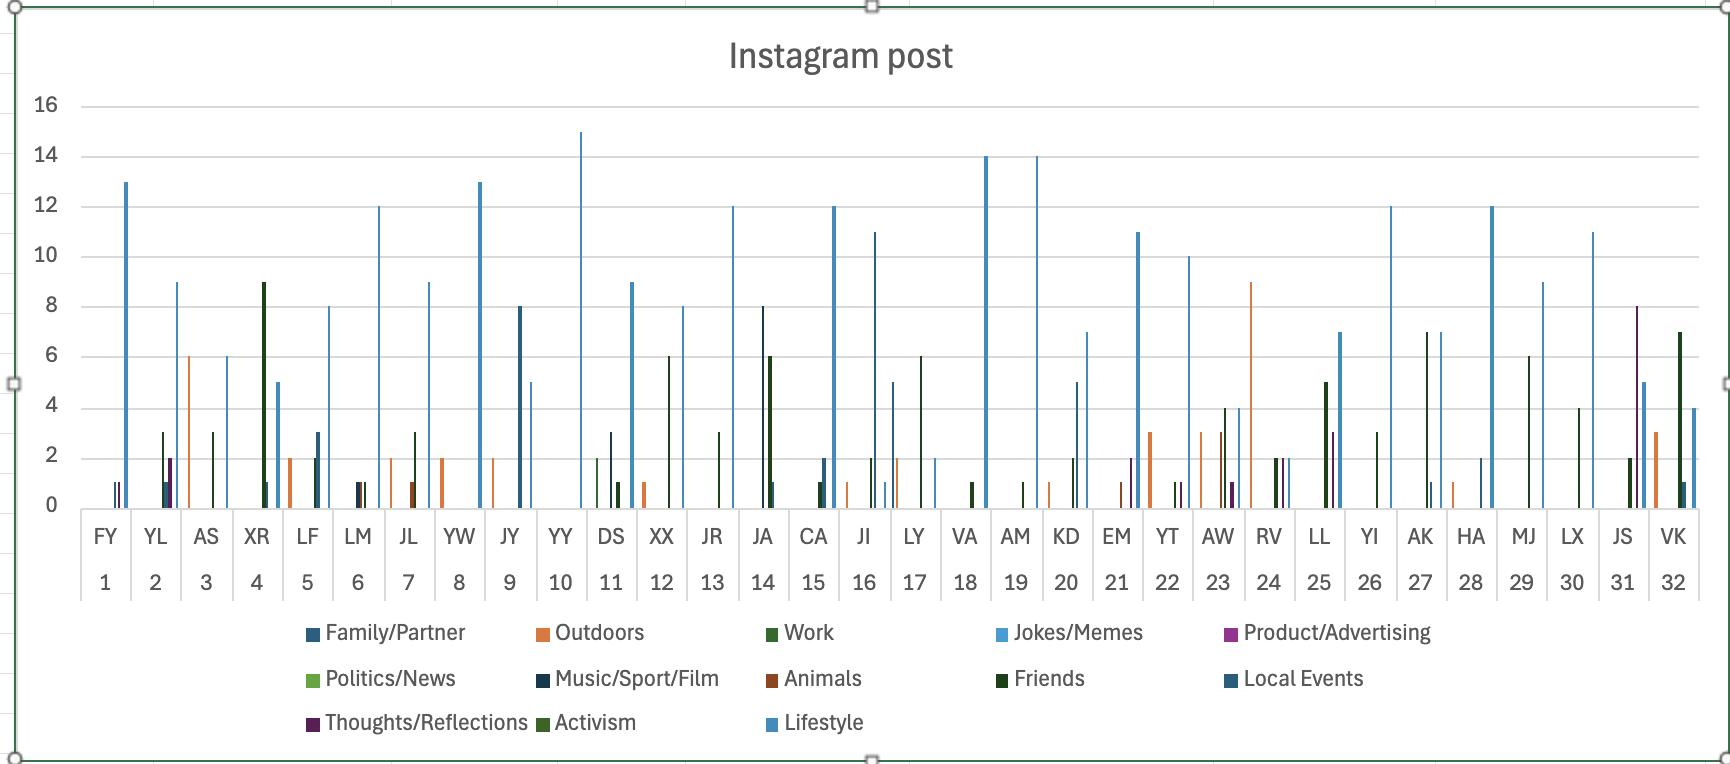
It was hard to see the information on the chart as too many people are included on the bar chart, though a comparison could be made for some categories, it would be difficult to do so. It could be seen that most of the posts fall into the category of lifestyle, so what my friends are trying to tell about their identity online was through their posts of photos of daily lives, selfies,etc. Though sometimes such representation might not represent the true identities as my friends do use photoshops to adjust their faces, it is still representing part of their identity. The graph I made could not tell about a detailed information about the spreadsheet, so in Wekk 9's workshop, we will continue on the process.
Week 9 November 29th
Digital Ethnography

As a follow up of the topic from Week 8 - identity and algorithmic identity, we used an additional method to examine questions related to it in Week 9, which is digital ethnography.
Before we begin the workshop task, it is important to know about some of the terms that are relevant. When I was doing the readings, since I already had some experience with ethnographic and digital ethnographic research, it was quite easy for me to understand. Pink et al.(2015) outlines that ethnography is a way of practicing research. In digital ethnography, it is in mediated contact rather than in direct presence. It might be something that we do online in different communities or groups. For what I have done before, tracking fans' behaviors in a fan groupchat might be a good example for digital ethnography.
The idea of Social Worlds was also prominent in the Pink et al.(2015) reading. They described social worlds as 'relatively bounded- but never airtight-domains of social life'.
During the workshop, we started off by finishing up the activity from Week 8's workshop by reflecting on our experiences of categorizing our friends' posts. What we first had to consider was that to reflect on Sumpter's Method.
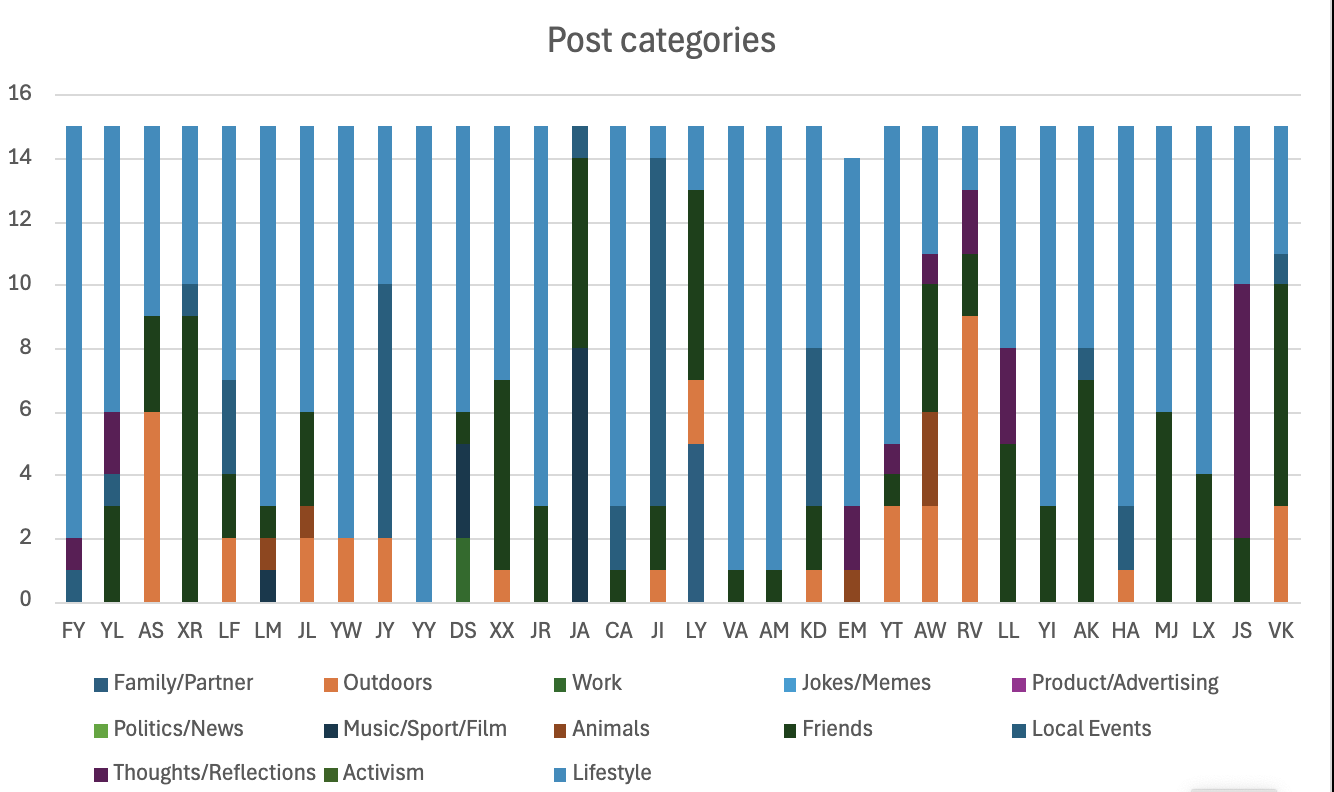 For what my chart have shown, most of my friends are representing their identities online through posting lifestyle photos. Almost none of them were representing themselves through posting work photos online. And finally that no one was posting photos relevant to politics/news, activism, jokes/memes. This have shown a relatively big difference when I compared my findings to my group member. He was categorizing posts on Facebook, while I was on Instagram. Due to the different affordances of the two platforms, Facebook have allowed different types of user experiences and interactions. However, while reflecting such method we have used, we both agreed that it might contain certain biases, as when we were categorizing the posts, it was definitely based on our definition of what each categories contain. Sometimes it might not be as accurate. It would be hard to say that what we have categorized is what our friends really wanted to represent. Furthermore, certain posts on Instagram might create a confusion when they are seen in a combination of photos and texts. What people put into the caption might not match the photos. Therefore, we said that if we are doing the Sumpter's method once again, it is really important to create a codebook to clarify what each categories include and not, so that when we are going through the data, there would be no confusion made. Sumpter's categories might be half accurate and half not of the representation of online identitiy.
Through my friends' results, some of their online identity do not 100% reflect their offline identity, so it is hard to say if the method is 100% accurate.
For what my chart have shown, most of my friends are representing their identities online through posting lifestyle photos. Almost none of them were representing themselves through posting work photos online. And finally that no one was posting photos relevant to politics/news, activism, jokes/memes. This have shown a relatively big difference when I compared my findings to my group member. He was categorizing posts on Facebook, while I was on Instagram. Due to the different affordances of the two platforms, Facebook have allowed different types of user experiences and interactions. However, while reflecting such method we have used, we both agreed that it might contain certain biases, as when we were categorizing the posts, it was definitely based on our definition of what each categories contain. Sometimes it might not be as accurate. It would be hard to say that what we have categorized is what our friends really wanted to represent. Furthermore, certain posts on Instagram might create a confusion when they are seen in a combination of photos and texts. What people put into the caption might not match the photos. Therefore, we said that if we are doing the Sumpter's method once again, it is really important to create a codebook to clarify what each categories include and not, so that when we are going through the data, there would be no confusion made. Sumpter's categories might be half accurate and half not of the representation of online identitiy.
Through my friends' results, some of their online identity do not 100% reflect their offline identity, so it is hard to say if the method is 100% accurate.
In the second section of the workshop, we dived into deeper of communties, this is where we started with ethnographies. What I have chosen for the activity was a Weverse community for NCT 127. The community is created for the fans of the group on weverse, where interactions between fans and artists could be made. However, it requires to be signed up in order to access the community. Fans in the community shares a certain knowledge, for instance, they use emojis to represent each member instead of using their names, they use green color as it is the official color for the group, etc. After I have put down some fieldnotes about my community, I shared them with my partner. Then, I exchanged my community with partner. So, I went on the Youtube Channel of Mr Tardis. It is a community built up to invest in Doctor Who, often engaging in the way of reviews, and discussions. Compared to what I have chosen, it is a totally differnt community. It might be the result of the platforms, as Youtube and Weverse have different affordances, the interactions they have allowed are totally different. Moreover, in Mr Tardis, it is expressing some critical opinions regarding the episodes. This is what I find most confusing about, since I am not that familiar with the content, I did not have the clue of such way of expression.